Probablity
how to predict the likely hood of a certain outcome
Probability – making the best estimate of the chance in an uncertain world
Table of Contents
- Basic Probability
- Compound Probability
- Probability Distributions
- Frequentist Inference
- Bayesian Inference
- Regression Analysis
- References
Basic Probability
Probability theory is the mathematical framework that allows us to analyze chance events in a logically sound manner.
- Chance Events
- Expectation: provides a measure of centrality
- The expectation of a random variable is a number that attempts to capture the center of that random variable’s distribution.
- It can be interpreted as the long-run average of many independent samples from the given distribution.
- More precisely, it is defined as the probability-weighted sum of all possible values in the random variable’s support,
- Variance: quantifies the spread of that random variable’s distribution
Compound Probability
- Set: a collection of compound events
- Permutations: different ordered sequences
- Combinations: different unordered sets
- Conditional Probability: a conditional probability is the probability of an event, given some other event has already occurred.
- It allows us to account for information we have about our system of interest
- Mathematically, computing a conditional probability amounts to shrinking our sample space to a particular event.
- A visual explaination
For example, we might expect the probability that it will rain tomorrow (in general) to be smaller than the probability it will rain tomorrow given that it is cloudy today. This latter probability is a conditional probability, since it accounts for relevant information that we possess.
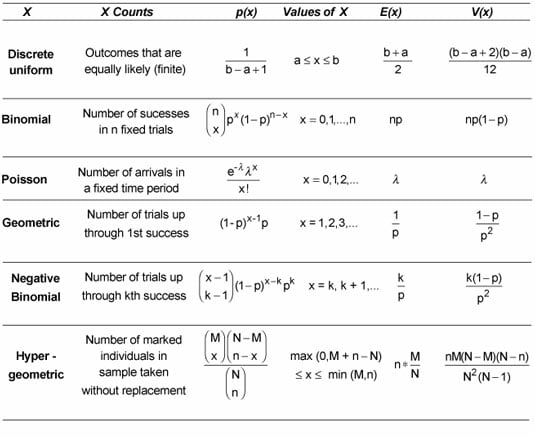
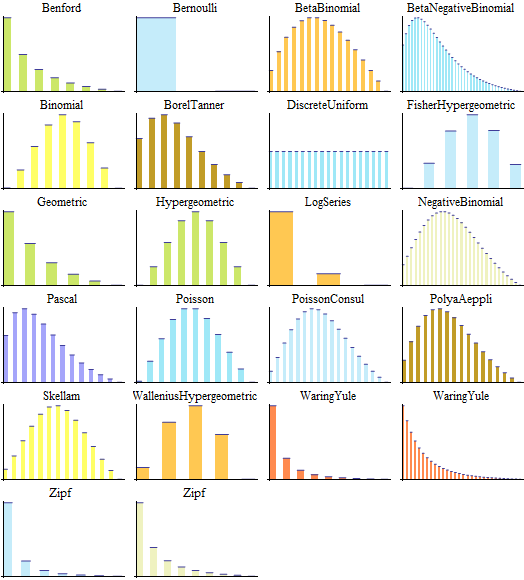
Probability Distributions
A probability distribution specifies the relative likelihoods of all possible outcomes.
-
Random Variables: Formally, a random variable is a function that assigns a real number to each outcome in the probability space.
-
The Central Limit Theorem (CLT) states that the sample mean of a sufficiently large number of i.i.d. random variables is approximately normally distributed. The larger the sample, the better the approximation.
Frequentist Inference
- Bootstrap provides a convenient way to estimate properties of an estimator via resampling.
Bayesian Inference
Bayesian inference techniques specify how one should update one’s beliefs upon observing data.
Regression Analysis
- Analysis of Variance (ANOVA) is a statistical method for testing whether groups of data have the same mean. ANOVA generalizes the t-test to two or more groups by comparing the sum of square error within and between groups.
References
- Probability by Khan Academy
- Harvard Statistics 110: Probability
- A visual introduction to probability and statistics
- Python for probability statistics and machine-learning
- Probabilistic reasoning and statistical analysis in TensorFlow
- The story of every distribution - Discrete Distributions
Last modified February 8, 2020